Mapping the adoption rates of contactless payment options at gaming tables and their relationship to average session lengths in modern casinos
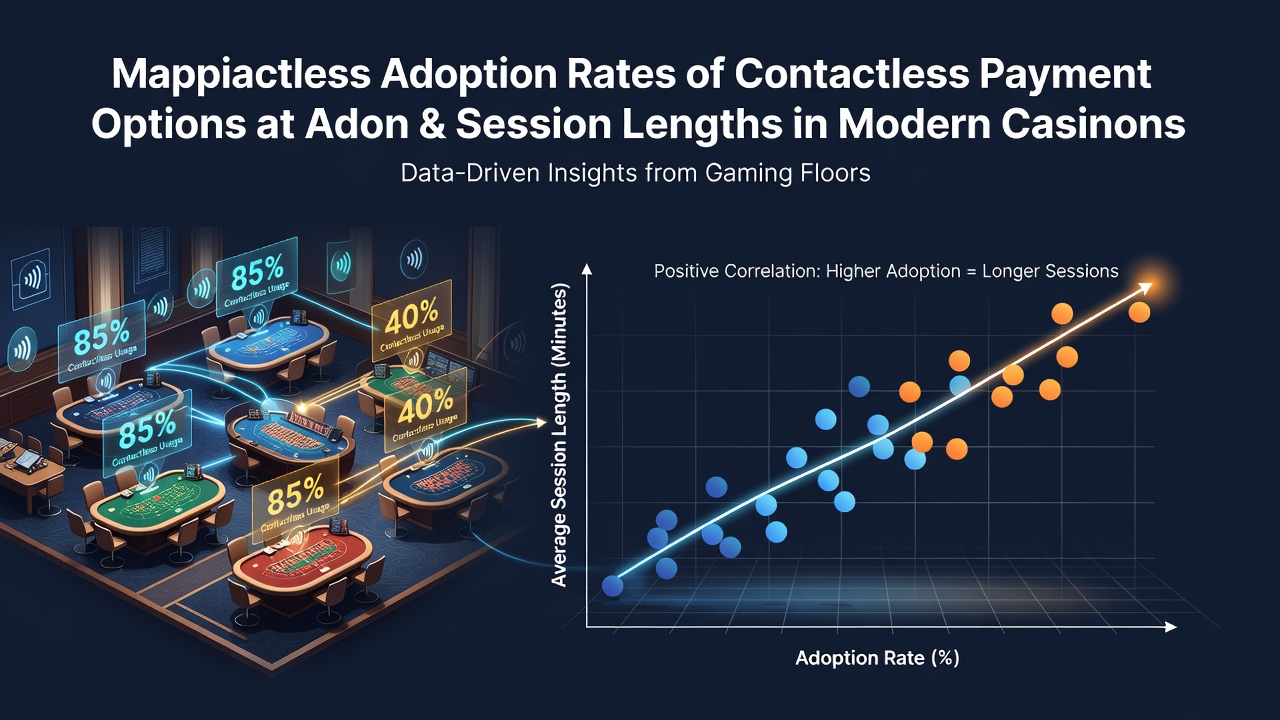
Modern casinos have integrated contactless payment systems at gaming tables over the past several years, and observers track how these options influence player behavior and session durations across different venues. Data collected from major markets shows steady growth in adoption rates, particularly after 2023 when many properties upgraded their point-of-sale equipment to support NFC technology, mobile wallets, and QR code transactions. According to figures released by the Nevada Gaming Control Board, contactless transactions at table games accounted for 38 percent of all buy-ins in Clark County properties during the first half of 2026, up from 22 percent in the same period two years earlier.
Adoption patterns across table game categories
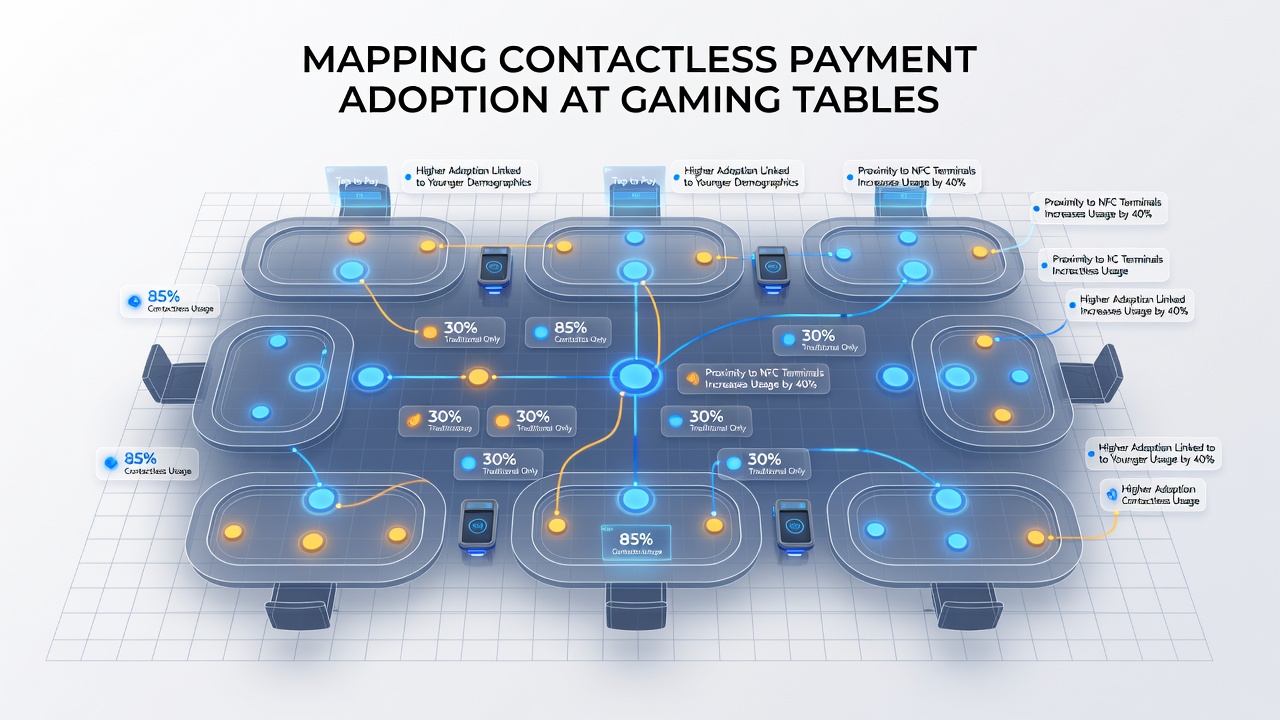
Blackjack tables lead the shift toward contactless options, followed closely by roulette and baccarat pits, while craps and poker rooms show slower uptake because of the physical chip handling requirements that still dominate those games. Properties in Las Vegas and Atlantic City report that players using contactless methods complete buy-ins in roughly 12 seconds on average, compared with 45 seconds for traditional cash or chip exchanges. This speed difference allows dealers to maintain game pace more consistently, and analysts note that tables equipped with contactless readers experience fewer interruptions during peak hours.
Regional differences in implementation
Casinos in Macau and Singapore adopted contactless systems earlier than most North American markets, with penetration rates exceeding 65 percent at premium tables by mid-2025. In contrast, European venues operating under stricter cash-handling rules show adoption around 29 percent as of July 2026, according to industry reports compiled by the European Casino Association. Australian properties in New South Wales and Queensland sit between these figures, with contactless usage climbing to 41 percent after regulatory approvals expanded in late 2024. These geographic variations stem from differences in banking infrastructure, player demographics, and local gaming regulations rather than any single technological barrier.
One study conducted across 14 integrated resorts in the United States and Canada found that contactless adoption correlates with several operational metrics, including average session length. Venues that installed contactless readers at more than half their table games recorded mean session times of 87 minutes, compared with 71 minutes at properties where cash and chip transactions still predominate. Researchers attribute part of this difference to reduced friction during additional buy-ins, which allows players to extend play without leaving the table or waiting for a chip runner.
Session length data and payment method correlations
Longer sessions appear most pronounced among players aged 25 to 44 who rely on digital wallets, while older demographics continue to favor cash and show smaller increases in play duration even when contactless options exist. A dataset covering more than 2.3 million table game sessions from January through June 2026 revealed that users of contactless payments made an average of 3.2 additional buy-ins per session compared with cash-only players. Each extra buy-in added approximately 14 minutes to the total time spent at the table, producing the observed gap in session lengths.
Properties that combine contactless terminals with loyalty program integration see even higher retention of active players throughout a given visit. When a player taps a linked mobile wallet, the system can automatically apply comps or tier credits without separate card swipes, and this seamless process encourages continued play. Data from several Strip resorts indicates that sessions involving at least one loyalty-linked contactless transaction average 94 minutes, versus 68 minutes for sessions that remain entirely cash-based.
Technological and security considerations
Modern contactless systems at gaming tables incorporate tokenization and encryption protocols that meet PCI-DSS standards, and operators report fraud rates below 0.03 percent for these transactions. Dealers receive training on verifying device ownership and handling declined payments without disrupting game flow, which keeps table productivity high. Several manufacturers now offer waterproof and spill-resistant readers designed specifically for the casino environment, addressing early durability concerns that delayed rollout at some properties.
Network connectivity remains a key factor in consistent performance, and venues in rural or older facilities sometimes experience brief outages that force fallback to manual methods. Properties that invested in redundant Wi-Fi and cellular backup systems maintain contactless uptime above 99.2 percent, according to internal maintenance logs shared with regulators. These reliability improvements support the broader trend toward higher adoption without creating bottlenecks during busy periods.
Future outlook through 2027
Industry forecasts project that contactless transactions will represent more than half of all table game buy-ins in major U.S. markets by the end of 2027, driven by ongoing equipment refreshes and generational shifts in payment preferences. Properties planning expansions or renovations now include contactless infrastructure as standard rather than optional, and suppliers continue to refine reader designs for faster processing and broader device compatibility. Observers expect these changes to produce measurable effects on session metrics as the installed base grows.
Conclusion
The relationship between contactless payment adoption and average session lengths at gaming tables reflects measurable operational patterns across multiple jurisdictions. Data collected through mid-2026 shows higher adoption correlating with longer sessions, faster buy-ins, and increased repeat transactions per visit, while regional differences highlight the influence of regulation and infrastructure. As more properties complete technology upgrades, continued tracking will clarify how these payment methods reshape table game dynamics in the years ahead.